
Forecasting College Costs - 9/28/10
 | How much will the cost of tuition and required fees at a four-year college or university be next year on average? And how about four years from now when today's freshmen may be graduating? More |
Exhausting Unemployment Benefits - 9/24/10
 | Inquiring minds are asking "How many people have exhausted all of their unemployment and extended unemployment benefits?" More |
Life After Home Tax Credit - 9/22/10
 | The Home Buyer Tax Credit contained in the stimulus of 2009 has been given much credit for buoying the housing market. But recent housing market data suggest that the credit’s effect was limited, even while it lasted. More |
The Higher Ed Bubble - 9/22/10
 | We couldn't help but notice what would appear to be a really unique correlation between tuition gains at a four-year higher education institution in the United States and the total amount of money the U.S. federal government spends every year. More |
Defaults and Debt Decline - 9/20/10
 | The sharp decline in U.S. household debt over the past couple years has conjured up images of people across the country tightening their belts in order to pay down their mortgages and credit-card balances. A closer look, though, suggests a different picture: Some are defaulting, while the rest aren’t making much of a dent in their debts at all. More |
Shadow Housing Inventory - 9/20/10
 | The "Shadow Inventory" is comprised of all those distressed residential properties which we know will almost certainly be coming onto the market in the not-to-distant future. Let's take an in-depth look at this inventory and see whether it is a threat to housing markets around the country. More |
Where Money, People Migrate in U.S. - 9/20/10
 | Pick a state, a start date and an end date, and this tool will tell you how many people and how much income moved to and from that state, from and to every other state, in the time period you've chosen. More |
Uninsured by Income - 9/17/10
 | The chart shows the household income levels of those 50.67 million uninsured Americans. More |
College Costs: Widening Wedge - 9/17/10
 | The 2009 income figures came out today, and I immediately gravitated to my favorite barometer for the state of the economy: The earnings of young college grads–that is, mean earnings for full-time workers, ages 25-34, with a bachelor’s only. More |
Walking Away from Mortgages - 9/17/10
 | While there has been much debate about the ethics of walking away from a burdensome mortgage, the majority of Americans still believe such behavior is unacceptable, according to a report from Pew Research Center. More |
Stimulus and the Private Sector - 9/15/10
 | According to Keynesian economists, government hiring stimulates the private sector during a recession because government employees go out and spend much of their paychecks in the private sector, and extra demand is exactly what the private sector needs during a recession. But this year’s experience with census hiring contradicts that view. More |
How Much Does Your Job Cost? - 9/15/10
 | A very natural question to ask is "why aren't employers hiring?"If you want the bottom line answer, it's because many firms are unwilling to consider adding to their employee rosters because they don't believe their future prospects are bright enough to support the cost of adding additional people to their payroll. What is that cost? Well, you're in luck because our latest tool is designed to estimate the minimum amount of... More |
Union Members, By Industry - 9/13/10
 | Pie chart detailing which industries dominate union membership in America today. More |
Historical GDP Growth - 9/10/10
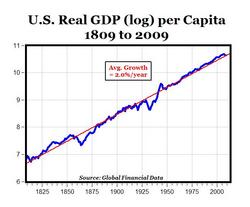 | Over the last 200 years going back to 1809, the chart above shows that the growth in real GDP per capita in the U.S. has been amazingly constant at an average of 2% year, with fluctuations around that long-term secular trend. |
Government Jobs Over Time - 9/09/10
 | Much of the growth of government employment over the years has come from state and local jobs. More |
Top of the Laffer Curve? - 9/09/10
 | Democrats have argued that current levels of taxation are far from the peak of the Laffer curve, implying that increases in tax rates could still bring in substantially more revenue. By contrast, Republicans have typically claimed that some rates of taxation are closer to the peak of the Laffer curve, or even potentially on the other side – implying that tax cuts (not increases) would raise revenue. So where is the... More |
College Tuition Vs. CPI - 9/07/10
 | Why is college tuition rising so much faster than prices in general, faster even than the unsustainable rise in home prices that led to a housing bubble (see top chart above)? Well, here's one explanation from the Goldwater Institute: Enrollment at... More |
HELOC of a Bad Time - 9/07/10
 | Because qualifying standards were based primarily on the equity in the home, HELOCs became nearly irresistible in those states where prices were rising rapidly in 2004-2005. Homeowners discovered that their home had actually become a money tree which they could shake almost at will. Aided by the seemingly limitless desire of banks to lend money, homeowners opened an incredible number of HELOCs during the bubble years... More |
Stocks: September Curse - 9/03/10
 | September is the month when kids go back to school, leaves turn yellow and gold, and stock prices drop like ripe apples. More |
Joblessness: The New Normal? - 9/03/10
 | The number of new unemployment claims is becoming flat at a level far higher than the average 318,000 level that was typical during the full-employment, low-unemployment years of 2006 and 2007. Instead, we find the level of new jobless claims would appear to be stabilizing around a level of 465,000 weekly claims, some 147,000 claims higher than would be consistent with a growing U.S. economy. More |
Too Much Housing - 9/01/10
 | Here’s a chart that to me sums up the past decade. This was supposed to be the Information Revolution…but what we mostly did was build homes. More |