The Obvious Reason for the Decline In Median Income
Much has been made recently of the fact that real median household income has been stagnant over the past twenty years and falling for the past seven. While there are many problems with using median household income as a measure of the economic health of the middle class, it is still important to examine what is causing this middle-income stall. A major, and overlooked, part of the answer appears to be quite simple: Americans are working less.
There are a multitude of problems with median income data. For one, many people use IRS data which is based on tax returns rather than actual households. Second, even if using the median household income from the Current Population Survey, the data does not include all non-market income like government transfers, employer-provided health insurance, and capital gains. Finally, a better measure would be after-tax and after-benefits so that it actually measured family purchasing power. For more details on these issues, see Scott Winship for several columns on these and related topics.
At an even more basic level, household size has been shrinking over time, so there are fewer people in the average household which seems likely to put downward pressure on household income. Still, median household income is important because it is such a convenient and easy-to-understand measure, representing the income of the household exactly in the middle of the national income distribution. That is, half of the country's households make more than the median and half make less.
Rather than revisit some of the problems with using median household income that have been pointed out by Scott Winship and others, I decided to focus here on pointing out a major cause of the trend in the observed data: a smaller percentage of people are working so there are fewer hours of work in each household. This is related to the infamous employment-population ratio that rose for decades until 2000 except for business cycle effects, but has been falling since.
What I did to get at the impact of working hours, household size, and the employment-population ratio was to go to the data. I collected the average hours worked per week from the Bureau of Labor Statistics. This is based on all employees. Then I got the total nonfarm employment numbers, also from BLS. Multiplying these two together gives me the total hours worked each week. I then divided this by the total number of U.S. households. The result is the average number of hours worked per household each week.
This is an average, not a median, so it is not the perfect match to median household income, yet the insight revealed is still rather remarkable. The chart below shows the average hours worked per household in blue and the real median household income in red (in $1000s). The pattern between the two is quite close; they rise and fall together and at very nearly the same rate. This suggests that any struggles by the middle class are not the result of unfair pay practices or too much income going to corporate profits, but rather are related to the amount of work being done.
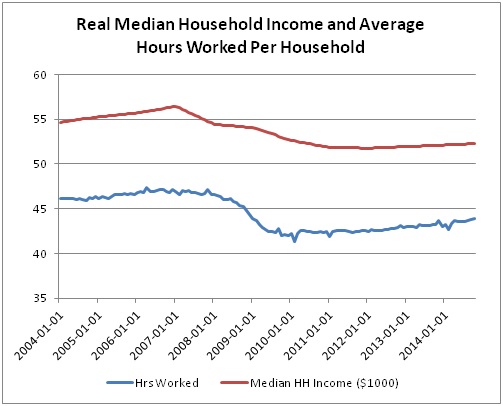
It certainly makes sense that if households do not work as many hours, the earnings of those households may struggle to rise. (The income is adjusted for inflation, so to rise here means to go up faster than inflation.)
Also, it is worth noting that the average hours worked per week has been remarkably consistent over this time period, ranging from a high of 39.5 hours per week to a low of 37.4. Over a decade, the average hours worked per week has dropped only 0.4 hours, about 1 percent. The decline in hours worked per household is due to fewer workers per household, not to more part-time employment.
Just to put things in simple numbers in case the graph is not convincing, since 2004, average hours worked per household has fallen 5.2 percent while real median household income has fallen by 4.6 percent. That implies a tiny gain in hourly pay above inflation, but also makes clear that if households were working the same number of hours as they did a decade ago, median household income would be in much better shape. The correlation between average household hours worked and median household income is an astounding 0.93 which means that they move in almost perfect synch with each other.
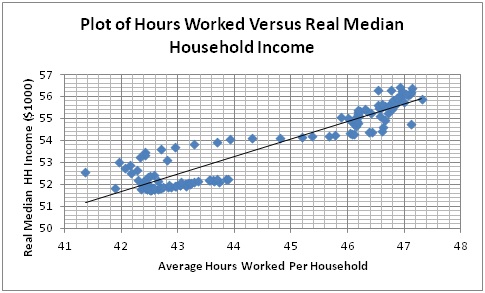
As another way to look at this data, I made a scatter plot of the points (with linear interpolations filling in the monthly values for median household income since hours worked is a monthly series and I had annual median household income). I added a linear regression (or trend) line that shows the approximate average relationship between the two series.
What the scatter plot below shows is, again, that hours worked seems to explain median household income quite well. The cluster of points to the top right is pre-recession, those on the bottom left are post-recession (with lower average hours worked per household), and the line of dots between the two clusters is the transition during the recession as the number of jobs per household declines.
For those looking for some conspiracy or a negative effect from the purported rise in income inequality, these data are not helpful. Instead, they provide a simple, clear insight: when people and families work fewer hours, they earn less money.
In medical school, doctors are taught to eliminate the simple, common illnesses before hunting for an obscure explanation of the symptoms presented. In a similar vein, before we go inventing new economic theories about how extreme income inequality must be hurting the middle class (we have no such theory today, only the hypothesizing of certain people), perhaps we should start with simple explanations. Incomes are a function of two variables: hours worked and earnings per hour.
Middle class incomes are not growing as fast as most people would like because middle class families are working fewer hours. Possible policy prescriptions could include pro-business moves to increase hiring or pro-work moves such as making the social safety net somewhat less comfortable than it has become over the past five to ten years. Either way, it seems clear that the major problem restricting faster growth in household incomes is not income inequality, nor corporate greed, but a basic lack of people working. Let's work on that before we start on the complicated stuff.