

With the 2020 campaign starting to rev up, what should investors expect next year? Besides a barrage of round-the-clock ads, soundbites and photo-ops jockeying for your attention, election years are generally favorable for stocks. Why? Not because stocks prefer certain candidates or parties. Fisher Investments’ advice? Tune out the loud political rhetoric and set aside any and all political biases—which can hamper investment decision-making. Instead, fathom what few appreciate: The falling uncertainty as election outcomes are decided is likely bullish in 2020, regardless of who prevails.
As hype over candidates’ policies grows, many investors fall into the trap of believing stocks have a better chance if their preferred party or politician looks likely to be in charge. If they aren’t, trouble awaits. But this is bias talking. A review of history shows neither party is innately good or bad for markets. That is why Fisher Investments urges staying politically agnostic when making investment decisions. Basing them on whether you like (or dislike) the party in power can be hazardous to your portfolio! Hence, we focus our political analysis on potential election outcomes’ likely impact on markets.
In the lead-up to elections, year three’s second-half and year four’s first-half returns are normally either a pause or gradual, uneven climb. This is when political uncertainty weighs most. Extreme primary campaign pledges—designed to galvanize the candidate’s base—stir fear of huge change. The pool of candidates is still too deep to assess who the likely nominee(s) will be—especially given this year’s wide Democratic field, which exceeds the GOP’s in 2016’s primaries. Beyond the White House, how Congressional elections will go is near-totally unknowable. It isn’t even clear who is running in many Senate and House races. Hence, it is impossible to forecast the eventual makeup of government—whether the Democrats take the White House and Congress, the GOP regains the House and holds the other two or the parties split the government. That is key to whether a president can actually enact promised legislation. Since probabilities are unknowable, uncertainty rises.
That rising uncertainty generally weighs on stocks. The president’s third year in office—which is 2019 for President Donald Trump—is the most positive of the four-year cycle, averaging 12.8% in price returns from 1931 through 2015.[i] However, most of that comes early. The S&P 500’s returns in year three’s first half average close to 10%. But returns tend to flatten out later. (Exhibit 1) This year seems to be playing to script. With 19 Democratic contenders still in the ring, radical proposals are flying fast and furious as candidates compete for attention. A potential impeachment maelstrom could further dominate headlines and weigh on sentiment. It wouldn’t surprise us if the uncertainty lingered into next year’s presidential primaries. No surprise, then, that stocks’ returns moderated to 1.2% in Q3 following 17.4% in this year’s first half.[ii]
Exhibit 1: Average Returns in Presidential Cycle Years Three and Four
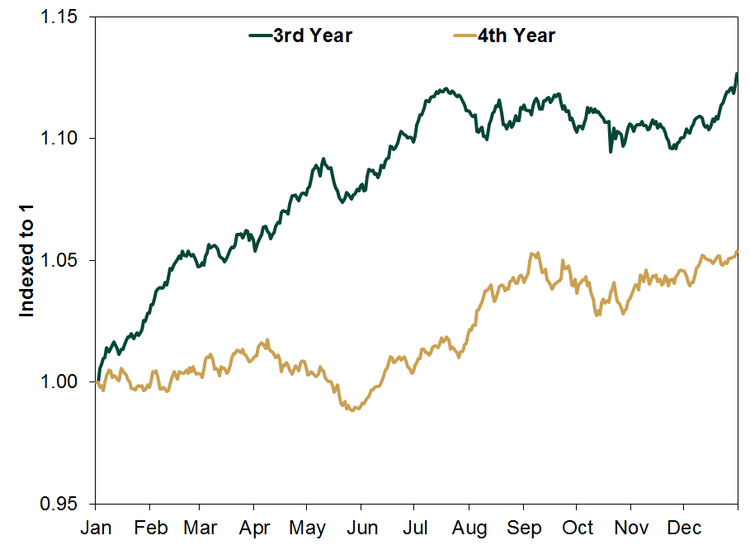
As the election draws near, primaries take place, frontrunners emerge and uncertainty starts falling. That is all before the vote. After the conventions formalize the head-to-head contest, markets can better price the probable victor. Senate and House races will be clearer then, too. Then, in November, the vote likely vanquishes election uncertainty in a flash. Hence, as Exhibit 1 also shows, stocks usually perform increasingly well from around the fourth year’s middle through its close.
Fisher Investments thinks that pattern will persist regardless of the eventual winner. For all the coverage and noise, next November’s vote will yield one of two results: a newly elected Democrat or a re-elected Republican. If a newly elected Democrat wins, a historical pattern we call the “Perverse Inverse” comes in play. (Exhibit 2) This stems from Democrats’ traditional anti-business campaign rhetoric. This cycle seems no different. In election years when Democrats prevail in November, markets typically post below-average returns. However, as new presidents moderate from their campaign pledges once in office or face gridlock, reality is better than feared. That usually drives higher-than-average returns in Democratic presidents’ inaugural years. The reverse tends to hold with newly elected Republicans. Traditionally pro-business campaign rhetoric stokes above-average election year returns, as markets price in hope over what they may do. Moderation and gridlock dash these hopes in the inaugural year, muting returns.
Exhibit 2: The Perverse Inverse

But the Perverse Inverse isn’t characteristic of Republican (or Democratic) incumbents. Second terms (from either party) are bullish on average during the election year because uncertainty isn’t as big a factor. (Exhibit 3) Now, of course, some may recall Trump’s inaugural year—2017—being quite good. But Fisher Investments finds that this meshes perfectly with the perverse inverse. Trump’s unconventional style and background—as well as his tough talk on trade—had many fearing his potential election would be bad for markets—how many investors typically approach Democratic presidential candidates. Hence, election year returns were very muted before the vote, then sprang into 2017.
Exhibit 3: Election Outcomes’ Historical Precedent for Stocks

So while uncertainty is high today and may weigh on near-term returns, it should fall as the election approaches—regardless of the eventual outcome. In our view, that is bullish. Clarity itself is a salve. It isn’t knowable exactly when clarity will start to perk. Hence, in our view, long-term equity investors should own stocks now to position for the falling uncertainty that looks likely to come.
Investing in stock markets involves the risk of loss and there is no guarantee that all or any capital invested will be repaid. Past performance is no guarantee of future returns. International currency fluctuations may result in a higher or lower investment return. This document constitutes the general views of Fisher Investments and should not be regarded as personalized investment or tax advice or as a representation of its performance or that of its clients. No assurances are made that Fisher Investments will continue to hold these views, which may change at any time based on new information, analysis or reconsideration. In addition, no assurances are made regarding the accuracy of any forecast made herein. Not all past forecasts have been, nor future forecasts will be, as accurate as any contained herein.
[i] Source: Global Financial Data, Inc., as of 3/12/2019. S&P 500 Index price returns during presidential cycles’ third years, 12/31/1930 – 12/31/2015.
[ii] Source: FactSet, as of 10/15/2019. S&P 500 Index price returns, 6/28/2019 – 9/30/2019 and 12/31/2018 – 6/28/2019.