
Inequality Is Decidedly Not the Problem In the U.S.

There is a simple theory of inequality in which rich people have nearly all the wealth and income, and do nearly all the spending, while poor people struggle along with the minimum of those things necessary for survival. It’s understandable that some people think this way. In many places in the world today, and for most complex societies in human history, the picture is accurate. Moreover, the rich elite usually hoards most of the economic opportunity, civil freedoms, political power, legal status and other good things for itself and its children.
But in the U.S. today, things are more complicated. Some people have wealth, others have income and still others do the spending. These things overlap but are not identical. Wealth, income and consumption also overlap with political influence, legal favoritism, social prestige and other non-monetary assets but the correlation with money is far from perfect.
This matters because if inequality is the problem, redistribution is the solution. The problems of the poor are caused by the hoarding of the rich. But if there are many different types of needy people due to different problems, redistribution based on wealth, income or consumption may end up taking from the needy and giving to the comfortable—doing considerable damage to civil rights, economic incentives and social trust along the way—and never addressing the root problems.
From income to spending

The usual approach to thinking about inequality gets things exactly backward. It starts with a graph similar to the one above, which shows average pre-tax income by decile from the lowest-income 10% (households with pre-tax income under $12,103) to the highest 10% (households with pre-tax income above $166,663).[i] This shows the top 10% of households with average pre-tax income 47 times that of the bottom 10%.
Next people usually adjust for factors that make things more equal. They recognize that pre-tax income is only a theoretical figure, what matters more is take-home pay, and people in higher income deciles pay more in taxes while people in the lower income deciles receive significant government benefits. Also, income numbers are one-year values. Many low-income people (such as students and young people starting out in their careers) have above-median lifetime prospects, while many higher-income people are having one good year—say from selling a house or business, or profiting from a temporary boom in their profession—that must pay for lean years in the past and future.
Moreover, looking at income does not adjust for expenses. Some households are big, some are only one person. Some have to locate in expensive places like San Francisco or New York to earn their income, others are in cheap places. Young and healthy people may have negligible healthcare expenses, while other households may devote 50% or more of their income to health.
Income cannot be measured precisely. There are definitional issues such as how to define “household” and how to treat unrealized capital gains, non-market transactions such as childcare provided by a stay-home parent and negative taxes like the Earned Income Tax Credit. And there are measurement issues like how to track income from the underground economy and to get accurate information from people who may be evading taxes or protecting privacy.
Finally, the goal is not clear. We want everyone to have enough for comfort and dignity, but do we want wealth equality between someone who works hard to become a world-class surgeon and her brother who only surfs and loafs? Should government clerks with secure jobs, good benefits and 9 to 5 hours earn the same as people who found and run successful businesses? Should people with expensive tastes be allowed to work hard to buy champagne and Teslas, while others can afford only beer and Chevys but can sleep later and spend more time with their kids?
When people make the adjustments above, they come to wildly different conclusions. Some find shocking inequality remains, others think things seem about right, or even that the penalties for success and rewards for indolence are excessive.
From spending to income
There is a fundamental problem with this approach, beyond the fact that the concept and data are so fuzzy that few people change their minds after looking at the numbers. It starts by assuming inequality, and then looks for adjustments that reduce it. The implied question is, “Do we redistribute enough?” It omits the more important question, “Are the problems of the poor caused by the existence of the rich?” This matters because if the answer is “yes,” redistribution is the solution, the question is, “How much?” But if the answer is “no,” we have to consider other solutions. We may have to tax the rich to pay for those solutions—after all, the rich is where the money is—but that’s quite different from taking from the rich to equalize things. Redistribution aims to extinguish rich and poor, putting them in opposition, progressive taxation to fund social programs harnesses the rich to improve the lot of the poor, putting them in partnership.
Instead of starting with pre-tax income and working to what households have available to spend, we should go in the opposite direction, and start with spending. This is shown in the next chart, which shows average spending per earner by income decile. Just as the income chart exaggerates inequality, the spending chart disguises it. But when we look for the hidden inequality, we find that there are several different major types, with different solutions. Income redistribution—such as increasing marginal tax rates on earners with above-median income and increasing government means-tested benefits—is clearly not the solution because if we take money from the top 60% of earners and give it to the bottom 40%, we’re taking from households that spend less per earner on average than the households receiving aid. Income redistribution may or may not be a good idea, but you can’t justify it as fighting inequality.

One major inequality invisible in the spending chart is inequality within income decile. The numbers shown are averages, within each decile are households spending more and less. This form of inequality is not rich versus poor, but high-spending households in all income deciles versus low-spending households in all income deciles.
In the lowest income decile, for example, are students with little or no income, who nevertheless spend a lot supported by parents, student loans and prior years’ savings. This pulls up the average spending, disguising the troubles of a minimum-wage, part-time, no-benefits worker trying to support a family. On the other hand, the lowest average spending per earner occurs in the 7th income decile, pre-tax income between $70,367 and $88,821. A young healthy single person earning this amount is probably comfortable, but a family with husband and wife each holding $36,000/year jobs could be struggling to make ends meet and save for children’s college and parent’s retirement.
Earners and non-earners
How is it possible that households with less than $12,103 in annual pretax income spend $50,618 per earner? The biggest reason is that more than half these low-income households have no earners, so they do not share in that $50,618.
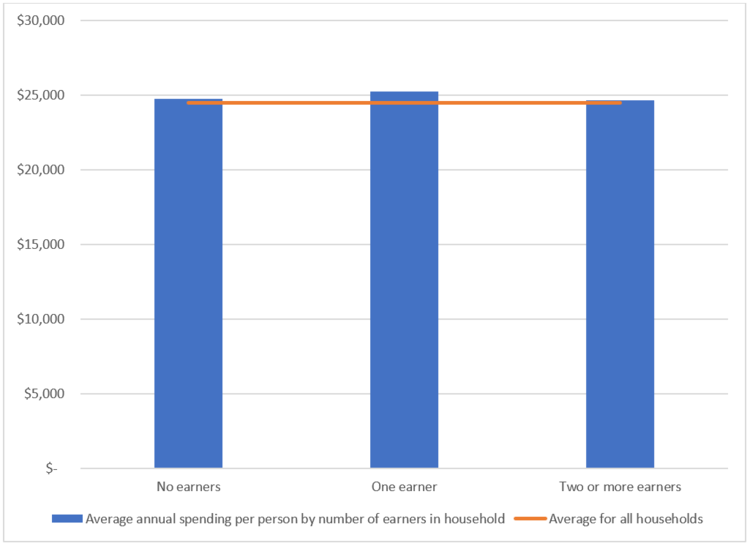
So maybe the problem is not households with low incomes, but households with no earners. Maybe we should look at average consumption per person, rather than per earner. The chart below shows that’s essentially identical for households with zero, one or more than one earner. So proposals to help non-earners at the expense of earners (such as raising payroll taxes to pay for increased social security and Medicare benefits) or earners at the expense of non-earners (such as minimum wage increases, pro-union rules or occupational licensing laws that increase income for low-wage workers while keeping other potential low-wage workers unemployed) cannot be justified as fighting inequality on average. As with more progressive income taxes, they may or may not be good ideas, but they’re not ways to reduce inequality.
Households with earners earn more pretax than they spend (for one thing, they have to pay taxes), but households with no earners spend considerably more than they earn. Earnings for these households come primarily from pensions (including social security), then from government benefits (including negative taxes), then from investment income. Many no-earner households have neither pensions nor investments, and therefore rely exclusively on benefits. These benefits can be adequate in some circumstances, meager in others. But the problems of the people with no earnings, pensions or investments; and inadequate government benefits; is not inequality. It’s either falling through the cracks of the social safety net, or deliberate policy choices.
Turning to the high end, how is it that the top 10% of households spends only $67,883 per earner, or $142,554 per household? What about all those yachts and private jets, and $10 million dollar parties with rock star entertainers, and mansions in every city? The answer is there aren’t many people who spend like that, and their consumption does not amount to much in the population statistics. They make good fodder for populist rants, but taking everything they spend and spreading it around wouldn’t make much difference.
Wealth

If inequality by pre-tax income decile or earner versus non-earner isn’t the problem, what is? One big one hidden in the consumption data is impact on household wealth. The above chart shows how much households were able to add to net worth over a year. It shows households in the lowest income decile had to borrow or to sell assets net to support spending, and the bottom 40% of households were unable to save much. This is during economic good times with low unemployment and rising asset prices. Many of these households are economically insecure—even if current spending is adequate—and will face problems in the next recession. Moreover, they may find it difficult to ever climb to financial security. And remember, these are averages. Some households in these income deciles are saving, which means others are either going into debt or selling off their assets.
Among the top 60% the average increase to net wealth seems reasonable, perhaps inadequate in many cases to fund secure retirements, but enough to weather periods of unemployment, stock market and real estate declines, illness or other reverses.
Although the change to net worth chart shows inequality, the savings problems of the bottom 40% are not caused by excessive investments by the top 60%, and the top 10%. One person investing doesn’t stop anyone else investing, in fact more capital tends to increase opportunities for additional investment. Moreover, the investments better-off households make create jobs, and produce goods and services, for everyone. If that money were not invested, it would make things worse for the bottom 40%, not better. You might argue that the government could take that money and invest it better, which may or may not be true, but that is a matter of relative investment competence, not inequality.
The bottom 50% of households spend more than their pretax income, although all but the lowest 10% manage to increase net worth on average due to negative taxes, rising asset prices and benefits. In many cases these households are building equity in pension plans and social security, which represent net worth in economic terms and are not counted in the numbers above. But most of those plans are underfunded, unfunded or subject to policy whims; and in any event do not cover everyone.
Economic insecurity and lack of assets by households earning less than the median is not caused by inequality, and the solution is not more redistribution. We already redistribute to the point that non-earners and earners have the same amount to spend per person, and low-income households spend more per earner on average than high-income households. Shoring up government pensions and social security is a better plan. Easier bankruptcy laws to protect assets and reduce debt oppression would help. Reducing the high marginal tax rates low-income workers often face on earned income—from payroll taxes and benefit reductions—would allow more people to transition from poor to middle-class via their own efforts. Stopping asset seizures from orphans, sick people and non-criminals indirectly tied to crimes means fewer citizens impoverished by their government. Cutting back on mass incarceration, excessive bail, occupational licensing and government funding by fines helps poor people build financial security.
However you feel about any of those proposals, or others, it’s clear that the social problems caused by the economy in the United States should not be viewed through a lens of simple generalized inequality, with crude redistribution the only solution. Low-income and high-income people each, on average, consume adequate amounts for dignified comfort; as do earners and non-earners. There are plenty of social and economic problems to tackle—people missed by government benefits either accidentally or on purpose, economic insecurity even among people with enough to spend today, government programs that make things worse, racism, sexism, crime and discriminatory criminal justice, child abuse and neglect, to name a few—but lumping them all together as inequality and promising to soak the rich until they go away is misguided.
[1] All statistics come from the latest Bureau of Labor Statistics Consumer Expenditure Survey released September 10, 2019